Monitoring at HelloFresh Part 2: Operating the Monitoring System

This is part 2 of the series of blog posts on how we do monitoring at HelloFresh. In the first article, we’ve shared details about our monitoring architecture that uses Prometheus and Thanos running on Kubernetes. In this post, we describe the overall process that keeps our monitoring system reliable enough for ingesting data, serving queries and alerting.
So, let’s get started.
Adopting SRE Practices
Monitoring is one of those systems that people usually forget about. It gets spun up and left behind because people think it just works. When data accumulates over time, all kinds of issues arise. Engineering teams that provide infrastructure as a service should be aware of it and consider the adoption of SRE operational practices before service quality is affected.
Monitoring is the bottom layer of the hierarchy of production needs. It is a basic requirement for running a service in production. Without it, service owners can’t even tell whether their service is working.

Monitor the Monitoring
So how do you monitor your monitoring system? Prometheus exposes several metrics from internal operations. Here are some key metrics to keep an eye on.
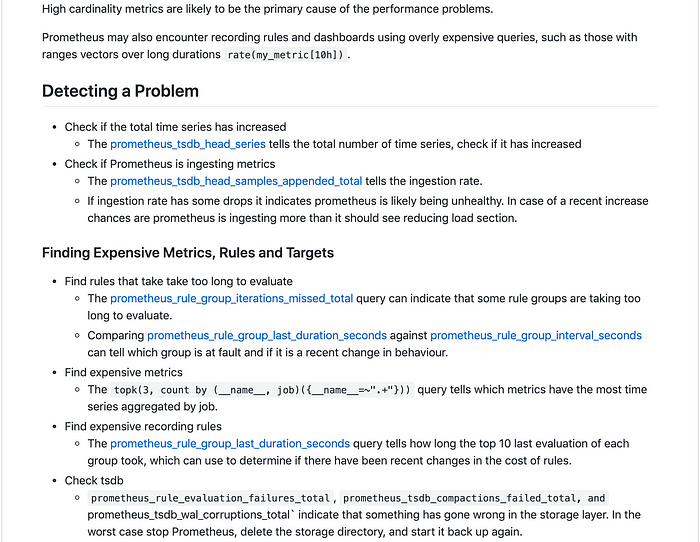
Metric: prometheus_tsdb_head_series
This metric indicates how many time series each instance holds. This is one of the first places to look when tackling performance issues on Prometheus. We are also interested to know how the time series grow over time.

Metric: prometheus_tsdb_head_samples_appended_total
The rate of this metric indicates the ingestion rate of every instance.
sum (
  rate (
    prometheus_tsdb_head_samples_appended_total[5m]
  )
) by (pod)
Ideally, this metric should be constant most of the time, like the green and yellow lines on the image below:

Metric: up{job=~”prometheus-servers.*”}
This metric averaged over time indicates the uptime for each instance.
avg (
  avg_over_time (
    up{job=~”prometheus-servers.*”}[5m]
  )
) by (pod)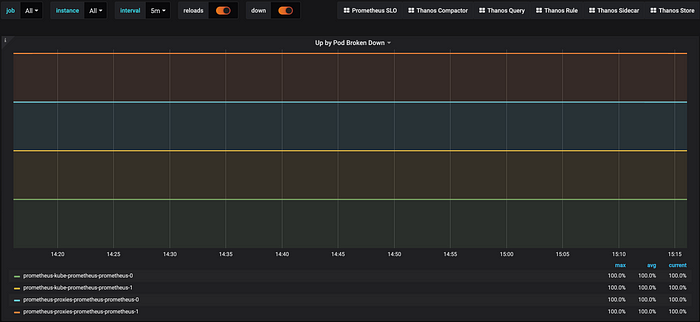
If the value isn’t 100%, a Prometheus instance is not having a good time!
Even though these 3 key metrics tell us a lot, there is much more data to look at. We imported and adapted the Prometheus 2.0 Overview dashboards into our Grafana for full visibility of the Prometheus internals.
Defining Reliability Targets with SLOs
Service Level Objectives, or SLOs are the fundamental basis of site reliability engineering work. Without them we can’t adopt error budgets to balance the addition of new features vs improving service reliability. Monitoring systems are no exception. We went through a lot of effort and chaos testing to establish good, data driven SLOs that measure what really matters for our Monitoring systems. In this section we’ll show how we calculate the SLIs that make up our SLOs.
Calculating Uptime
For the uptime SLO, we use the time based availability formula. We calculate a monthly percentage by taking the uptime of Prometheus and Thanos components over 5 minute intervals over the last 4 weeks. Achieving this in Prometheus is very straightforward:
- First we create a recording rule to track the uptime averaged over a 5 minutes window.
- record: kube_prometheus:up:max_avg_over_time5m
  expr: >
    max (
      avg_over_time (
        up{job="kube-prom"}[5m]
      )
    )
As described in Part 1 of our series, we’ve split Prometheus instances per functionality and each of them run in HA mode. In the event of all Prometheus instances being down, the period of downtime is counted — for example, when all prometheus instances responsible for reverse proxy metrics are down.
- Secondly, we get the average over time from the last 4 weeks.
- record: kube_prometheus:up:max_avg_over_time4w
  expr: >
    avg_over_time (
      kube_prometheus:up:max_avg_over_time5m[4w]
)- Lastly we take the average over all the components
- record: prometheus:slo:avg_over_time4w
  expr: >
  (
    kube_prometheus:up:max_avg_over_time4w +
    prox_prometheus:up:max_avg_over_time4w +
    thanos_components:up:max_avg_over_time4w
  ) / 3
We initially tried to do this with raw data, but we found this to be too resource intensive, and it caused performance issues.
Our SLO for the monitoring system is 99.9% of uptime/availability, resulting in the following periods of allowed downtime/unavailability:
- Daily: 1m 26s
- Weekly: 10m 4s
- Monthly: 43m 49s
- Yearly: 8h 45m 57s
Calculating the available error budget based on SLO and SLA can be done at uptime.is.
Tracking Query Latency
By tracking query latency over time, it has often helped us to spot potential issues much earlier than they would arise. We want to know the proportion of good queries that are getting slower over time.
Since the Thanos query component sits in front of both the Prometheus and Thanos store, it’s a good candidate to measure how fast our queries are overall. The implementation of the query latency recording rule is as follows:
- record: thanos_query:latency_slo_99th:avg_over_time4w
  expr: >
    histogram_quantile(
      0.99,
      sum (
        thanos_query:grpc_latency:avg_over_time4w
      ) by (le)
    )- record: thanos_query:grpc_latency:avg_over_time4w
  expr: >
    avg_over_time (
      thanos_query:grpc_successfull_queries_latency:rate5m[4w]
    )- record: thanos_query:grpc_successfull_queries_latency:rate5m
  expr: >
    rate (
      grpc_server_handling_seconds_bucket{job="thanos-query", grpc_code!~"Unknown|ResourceExhausted|Internal|Unavailable|DeadlineExceeded"}[5m]
    )
Our SLO for query latency is 99% of requests completed faster than 1s.
Alerting on SLOs
Dashboards are awesome, but we can’t check them all the time. Besides Prometheus we also operate many other services and we need to know proactively when something is too broken or is going to break soon on the monitoring side.
The SRE workbook defines multiple ways to alert on SLOs. There are more advanced ways of alerting, like on burn rates for example. Nonetheless as a starting point, alerting when the monitoring system SLIs are in danger has shown to be very efficient too.
Alerting when the SLO is in danger
You can combine the main SLIs in a specific recording rule. This rule is created in the same way as the Prometheus SLO, the only difference is the rate period of time, which in this case is 10 minutes.
rules:
  - alert: PrometheusUptimeTooLow
    annotations:
      summary: Prometheus uptime is too low during the last 10m
      runbook_path: platform-team/prometheus-uptime-too-low.md
    expr: prometheus:up:rate10m < 0.999
    for: 10m
    labels:
      pager: pagerduty
      team: platform
      severity: sev1
      tier: infra
At HelloFresh we have a modern on-call rotation in place. We have on-call shifts for product and infrastructure engineering services and we want to avoid paging on-call engineers for insignificant events.
Writing Runbooks
We attach runbooks to every sent alert as often as possible. By doing that they are more actionable and will help decrease the resolution time (MTTR).
Conclusion
At HelloFresh we take observability very seriously. We have learned a lot about how to operate monitoring infrastructure and are happy to share a little bit of our process for operating production services.
In the next post in this series, we’ll share how we empower engineering teams to have better observability on their services infrastructure.
Thank you for reading!